As an administrator you might notice sluggish response to Telnet sessions you attempt to establish with a router or longer-than-normal ping response times.
Such symptoms might indicate a router performance issue.
This section investigates three potential router issues, each of which might result in poor router performance. These three issues are
■ Excessive CPU utilization
■ The packet switching mode of a router
■ Excessive memory utilization
- A router’s processor (that is, CPU) utilization escalating to a high level but only remaining at that high level for a brief time could represent normal behavior.
- If a router’s CPU utilization continually remains at a high level, network performance issues might result.
- Aside from latency that users and administrators can experience, a router whose CPU is overtaxed might not send routing protocol messages to neighboring routers in a timely fashion. As a result, routing protocol adjacencies can fail, resulting in some networks becoming unreachable.
Processes That Commonly Cause Excessive CPU Utilization
Four processes that can result in excessive CPU utilization:
1) ARP Input process
Is in charge of sending ARP requests, can consume an inordinate percentage of CPU resources if the router has to send numerous ARP requests.
One configuration that can cause such a high number of ARP requests is having a default route configured that points to a broadcast network.
- For example, perhaps a router had the ip route 0.0.0.0 0.0.0.0 fa 0/1command entered in global configuration mode.
- Such a configuration can cause an ARP to be sent to all IP addresses available off of that broadcast interface that are not reachable via a better route.
- From a security perspective, numerous ARP requests can result from an attacker performing a ping sweep of a subnet.
2) Net Background process
An interface has a certain number of buffers available to store packets. These buffers are sometimes referred to as the queue of an interface.
If an interface needs to store a packet in a buffer but all the interface buffers are in use, the interface can pull from a main pool of buffers that the router maintains. The process that allows an interface to allocate one of these globally available buffers is Net Background. If the throttles, ignored, and overrun parameters are incrementing on an interface, the underlying cause might be the Net Background process consuming too many CPU resources.
3) IP Background process
Handles an interface changing its state. A state change might be an interface going from an Up state to a Down state, or vice versa.
Another example of state change is an interface’s IP address changing.
- Therefore, anything that can cause repeated state changes, such as bad cabling, might result in the IP Background process consuming a high percentage of CPU resources.
4) TCP Timer process
Runs for each TCP router connection.Therefore, many connections can result in a high CPU utilization by the TCP Timer process.
ARP Problem with static route and exit interface as Ethernet
 |
| R1 will have incorrect static route |
R1(conf_t)# ip route 0.0.0.0 0.0.0.0 FastEthernet0/0
R1# ping 8.8.8.8 repeat 2
*Nov 30 22:37:15.831: ARP TABLE: inserting entry 8.8.8.8/0000.0000.0000 on Fa0/0 for Incomplete
*Nov 30 22:37:15.831: ARP DYNAMIC: set up subblock for 8.8.8.8 in tableid 0
*Nov 30 22:37:15.843: ARP TABLE: modifying entry 8.8.8.8/ca02.5cca.0008 on Fa0/0 for Dynamic
*Nov 30 22:37:15.847: IP ARP ADJ: queueing to install adjacency for 8.8.8.8 on FastEthernet0/0
*Nov 30 22:37:15.847: ARP DYNAMIC: set up subblock for 8.8.8.8 in tableid 0
*Nov 30 22:37:15.847: ARP TABLE: modifying entry 8.8.8.8/ca01.5cca.0008 on Fa0/0 for Dynamic
*Nov 30 22:37:15.851: IP ARP ADJ: queueing to install adjacency for 8.8.8.8 on FastEthernet0/0
*Nov 30 22:37:15.851: ARP DYNAMIC: set up subblock for 8.8.8.8 in tableid 0
*Nov 30 22:37:15.855: IP ARP ADJ: process adjacency event INSTALL for 8.8.8.8 on FastEthernet0/0
*Nov 30 22:37:15.855: IP ARP ADJ: install adjacency for 8.8.8.8 on FastEthernet0/0
.!
Success rate is 50 percent (1/2), round-trip min/avg/max = 12/12/12 ms
R1#
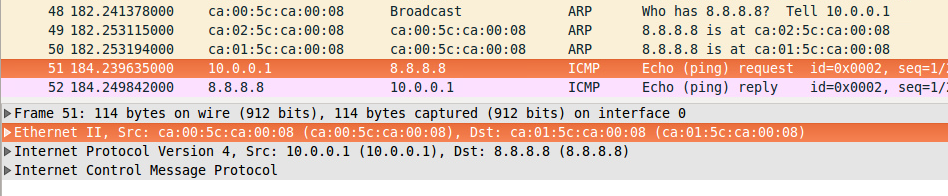 | ||
| MAC of latest Router who will ARP Reply, will be used as DST MAC |
If you point a static route to a broadcast interface, the route is inserted into the routing table only when the broadcast interface is up. This configuration is not recommended because when the next hop of a static route points to an interface, the router considers each of the hosts within the range of the route to be directly connected through that interface. For example, ip route 0.0.0.0 0.0.0.0 Ethernet0.
With this type of configuration, a router performs Address Resolution Protocol (ARP) on the Ethernet for every destination the router finds through the default route because the router considers all of these destinations as directly connected to Ethernet 0.
PROBLEM DESCRIPTION: http://blog.ipspace.net/2009/10/my-stupid-moments-interface-default.html
PROBLEM SOLUTION: http://blog.ipspace.net/2009/10/follow-up-interface-default-route.html
Cisco IOS Commands Used for Troubleshooting High Processor Utilization
show arpExample output
! Displays the ARP cache for a router. If several entries are in the Incomplete state, you might suspect a malicious scan (for example, a ping sweep) of a subnet.
show interface <interface-id>
! Displays a collection of interface statistics. If the throttles, overruns, or ignore counters continually increment, you might suspect that the Net Background process is attempting to allocate buffer space for an interface from the main buffer pool of the router.
show tcp statistics
! information about the number of TCP segments a router sends and receives, including the number of connections initiated, accepted, established, and closed.
! a high number of connections can explain why the TCP Timer process might be consuming excessive CPU resources.
show processes cpu
! displays average CPU utilization over 5-second, 1-minute, and 5-minute intervals, in addition to listing all the router processes and the percentage of CPU resources consumed by each of those processes.
show processes cpu history
! displays a graphical view of CPU utilization over the past 60 seconds, 1 hour, and 3 days. This graphical view can indicate if an observed high CPU utilization is a temporary spike in utilization or if the high CPU utilization is an ongoing condition.
ARP
R2#show arp
Protocol Address Age (min) Hardware Addr Type Interface
Internet 10.3.3.2 61 0009.b7fa.d1e0 ARPA Ethernet0/0TCP
Internet 10.3.3.1 - 00d0.06fe.9ea0 ARPA Ethernet0/0
Internet 192.168.1.50 0 Incomplete ARPA
R1# show tcp statisticsCPU
Load for five secs: 14%/11%; one minute: 14%; five minutes: 14%
Time source is NTP, 12:08:28.362 EET Fri Nov 28 2014
Rcvd: 31481041 Total, 7271 no port
10795 checksum error, 9888 bad offset, 0 too short
28762386 packets (239026130 bytes) in sequence
0 packets (0 bytes) in CEF
38668 dup packets (4217801 bytes)
87066 partially dup packets (10016590 bytes)
4 out-of-order packets (86 bytes)
0 packets (0 bytes) with data after window
0 packets after close
0 window probe packets, 324 window update packets
303 dup ack packets, 0 ack packets with unsend data
1487302 ack packets (54568404 bytes)
0 ack packets (0 bytes) in CEF
Sent: 30908859 Total, 2 urgent packets
604251 control packets (including 28 retransmitted)
1542941 data packets (54546089 bytes)
0 data packets (0 bytes) in CEF
222 data packets (7690 bytes) retransmitted
0 data packets (0 bytes) fastretransmitted
28234961 ack only packets (25407122 delayed)
0 ack only packets in CEF
0 window probe packets, 526468 window update packets
12196 Connections initiated, 752 connections accepted, 12819 connections established
1149803 Connections closed (including 601 dropped, 568497 embryonic dropped)
250 Total rxmt timeout, 0 connections dropped in rxmt timeout
9698 Keepalive timeout, 9698 keepalive probe, 3 Connections dropped in keepalive
R1#
R1#sh proc cpu | inc utili|PID|ARP Back|Net Back|TCP Timer|IP Back
CPU utilization for five seconds: 19%/11%; one minute: 15%; five minutes: 14%
PID Runtime(ms) Invoked uSecs 5Sec 1Min 5Min TTY Process
31 12196 19532716 0 0.00% 0.00% 0.00% 0 ARP Background
48 15248172 7631874 1997 0.07% 0.12% 0.13% 0 Net Background
136 46396 25133016 1 0.00% 0.01% 0.00% 0 TCP Timer
148 84 312383 0 0.00% 0.00% 0.00% 0 IP Background
CPU History
R1#show processes cpu history
111111111111111111111111111111111111111111111111111111111111
444444444444444555559999944444555555555577777555554444444444
100
90
80
70
60
50
40
30
20 ********** ********************
10 ************************************************************
0....5....1....1....2....2....3....3....4....4....5....5....6
0 5 0 5 0 5 0 5 0 5 0
CPU% per second (last 60 seconds)
....OUTPUT OMMITED
Understanding Packet Switching Modes
- In addition to the high CPU utilization issues previously discussed, a router’s packet switching mode can impact router performance.
Cisco routers support the following three primary modes of packet switching:
■ Process switching
■ Fast switching
■ Cisco Express Forwarding
Operation of Process Switching
- When a router receive a packet, the router removes the packet’s Layer 2 header, examines the Layer 3 addressing, and decides how to forward the packet.
- The Layer 2 header is then rewritten (insert new SRC and DST MAC addresses and computing a new CRC), and the packet is forwarded out of the appropriate interface.
- With process switching, the router’s CPU becomes directly involved with packet switching decisions.
- As a result, the performance of a router configured for process switching can suffer significantly.
- An interface can be configured for process switching by disabling fast switching on that interface.
R(config-if)# no ip route-cacheOperation of Fast Switching
- Fast switching uses a fast cache maintained in a router’s data plane.
- The fast cache contains information about how traffic from different data flows should be forwarded.
- The first packet in a data flow is process-switched by a router’s CPU.
- After the router determines how to forward the first frame of a data flow, that forwarding information is stored in the fast cache.
- Subsequent packets in that same data flow are forwarded based on information in the fast cache, as opposed to being process-switched.
- Fast switching reduces a router’s CPU utilization more than process switching does.
- Fast switching can be configured in interface configuration mode with the command
R(config-if)# ip route-cacheOperation of Cisco Express Forwarding
- CEF maintains two tables in the data plane.
- CEF can efficiently make forwarding decisions, using these tables, populated from a router’s IP routing table and ARP cache.
- Unlike fast switching, CEF does not require the first packet of a data flow to be process-switched.
- Rather, an entire data flow can be forwarded at the data plane.
- On many router platforms, CEF is enabled by default.
- If it is not, you can globally enable it with the
R(config)# ip cef- Alternatively, you can enable CEF for a specific interface with the interface configuration mode command
R(config-if)# ip route-cache cef
Troubleshooting Packet Switching Modes
show ip interface <interface_id>Examples:
! Displays multiple interface statistics, including information about the packet switching mode of an interface.
show ip cache
! Displays the contents of fast cache from a router if fast switching is enabled.
show processes cpu | include IP Input
! Displays information about the IP input process on a router. The CPU utilization for this process might show a high value if the CPU of a router is actively engaged in process-switching traffic
show ip cef
! Displays the contents of a router FIB
show ip cef adjacency <egress-interface-id> <next-hop-ip-address> detail
! Displays destinations reachable via the combination of the specified egress interface and next-hop IP address.
show adjacency detail
! Provides information contained in the adjacency table of a router, including protocol and timer information.
show cef not-cef-switched
! Displays information about packets the router forwards using a packet switching mechanism other than CEF
Interface and CEF
R1# sh ip int FastEthernet0/1.221 | inc IP fast|Flow|CEFIf fast switching is enabled and CEF is disabled, a router begins to populate its fast cache.
IP fast switching is enabled
IP fast switching on the same interface is enabled
IP Flow switching is disabled
IP CEF switching is enabled
IP CEF switching turbo vector
IP CEF turbo switching turbo vector
IP route-cache flags are Fast, CEF
Output features: Post-Ingress-NetFlow
R4# show ip cacheCEF
IP routing cache 3 entries, 588 bytes
12 adds, 9 invalidates, 0 refcounts
Minimum invalidation interval 2 seconds, maximum interval 5 seconds,
quiet interval 3 seconds, threshold 0 requests
Invalidation rate 0 in last second, 0 in last 3 seconds
Last full cache invalidation occurred 04:13:57 ago
Prefix/Length Age Interface Next Hop
10.8.8.4/32 00:00:07 FastEthernet0/1 10.8.8.4
10.8.8.6/32 00:00:10 FastEthernet0/1 10.8.8.6
- if a next-hop of the network prefix is set to receive, that network is local to the router, whereas attached indicates that the network is directly connected to the router.
R1#sh ip cef | inc Prefix|atta|receiCEF PUNTED PACKETS
Prefix Next Hop Interface
0.0.0.0/32 receive
10.18.6.16/29 attached GigabitEthernet0/3.10
10.18.6.16/32 receive GigabitEthernet0/3.10
10.18.6.17/32 receive GigabitEthernet0/3.10
10.18.6.18/32 attached GigabitEthernet0/3.10
10.18.6.19/32 attached GigabitEthernet0/3.10
R1#show cef not-cef-switched
Load for five secs: 12%/10%; one minute: 15%; five minutes: 15%
Time source is NTP, 12:29:37.651 EET Fri Nov 28 2014
% Command accepted but obsolete, see 'show (ip|ipv6) cef switching statistics [feature]'
IPv4 CEF Packets passed on to next switching layer
Slot No_adj No_encap Unsupp'ted Redirect Receive Options Access Frag
RP 0 0 42957290 1 3774814473 1 26952362 0
IPv6 CEF Packets passed on to next switching layer
Slot No_adj No_encap Unsupp'ted Redirect Receive Options Access MTU
RP 0 0 33103182 0 32908045 0 0 0
ACL Logging and Process Switching
https://www.cisco.com/c/en/us/about/security-center/access-control-list-logging.html
- In order for IOS to log the packets, each packet that matches an ACE configured with a log/log-input keyword has to be process switched instead of CEF switched.
- For ACEs that match a lot of packets, this aspect can be undesirable and lead to high CPU utilization.
There are two primary factors that contribute to the CPU load increase from ACL logging:
- process switching of packets that match log-enabled access control entries (ACEs)
- and the generation and transmission of log messages.
log: %SEC-6-IPACCESSLOGP: list Block_SSH denied tcp 192.168.0.42(30316) -> 1.1.1.1(22), 1 packet
log-input: %SEC-6-IPACCESSLOGP: list Block_SSH denied tcp 192.168.0.42(15111) (FastEthernet0/1 c203.73ae.0001) -> 1.1.1.1(22), 1 packet
Limiting ACL Logging–Induced Process Switching
IOS provides a knob to rate-limit the number of packets that are process switched due to logging ACEs. As with the log-update knob, this also has a global effect and there is no filtering or fine-tuning available.
Command:
R2(config)# ip access-list logging interval <?> !! interval-in-ms
Access list logging interval (milliseconds) !! allow 1 packet in <interval> specified
! a value of:
500 = 1 packet to be process switched every 0.5s 5000 = 1 packet to be process switched every 5 seconds or in other words, 12 packets every minute.
Example:
R2(config)#ip access-list logging interval 2000
Essentially, R2 will now allow 1 packet to be process switched every 2 seconds.
Configuring a Log Update Threshold
Configure how often syslog messages are generated and sent after the initial packet match.
ip access-list log-update threshold <threshold-in-msgs> ! number of packets, not as a time interval
ipv6 access-list log-update threshold <threshold-in-msgs> ! number of packets, not as a time interval
Rate Limiting Syslog Messages
The logging rate-limit message-rate [except severity-level] command limits the CPU impact of log generation and transmission. This command applies to all syslog messages and is not exclusive to those created through ACL logging. Although this command does limit the number of packets that must be generated and sent by the network device, it does nothing to reduce the number of input packets that are process switched by the device CPU. For this reason, it is imperative that the ip access-list logging interval command be used in conjunction with the logging rate-limit command.
The logging rate-limit command was introduced in IOS 12.1(3)T.
Logging configuration example:
!-- Configure timestamps for syslog messages with date, time, milliseconds, and the time zone
service timestamps log datetime msec show-timezone localtime
!
!-- Enable logging to all enabled destinations.
logging on
!
!-- Disable CPU-intensive logging to the console and terminal.
no logging console
no logging monitor
!
!-- Configure logging severity level, log buffer size, and rate limiting.
logging buffered informational
logging buffered 16386
logging rate-limit 100 except 4
!
!-- Configure the host to which syslog messages will be sent.
logging 192.168.1.10
!
!-- Configure the interval between process-switched packets.
ip access-list logging interval 10
Excessive Memory Utilization
- router performance can suffer if it lacks sufficient available memory.
- example: install a version of Cisco IOS on a router, and that router does not have the minimum amount of memory required to support that specific Cisco IOS image. Even though the router might load the image and function, its performance might be sluggish.
Common Memory Troubleshooting Targets
Assuming a router doeshave the recommended amount of memory for its installed Cisco IOS image, consider the following as potential memory utilization issues:
1) Memory leak
When a router starts a process, that process can allocate a block of memory. When the process completes, the process should return its allocated memory to the router’s pool of memory. If not all the allocated memory is returned to the router’s main memory pool, a memory leak occurs. Such a condition usually results from a bug in the Cisco IOS version running on the router, requiring an upgrade of the router’s Cisco IOS image.
R1#show memory allocating-process totalsFollowing this summary information, the output shows detailed memory allocation information for each process running on a router.
Head Total(b) Used(b) Free(b) Lowest(b) Largest(b)
Processor 670A75C0 368411916 107920808 260491108 259476048 250971404
I/O E000000 33554432 7149704 26404728 26383040 26349436
Transient 7D000000 16777216 383716 16393500 16065568 16393476
Allocator PC Summary for: Processor
Displayed first 2048 Allocator PCs only
PC Total Count Name
0x61968230 11620316 45771 EIGRP-Core: DRDB
0x6196DD38 6692788 22930 EIGRP-Core: DNDB
0x62637F10 4442792 267 IPv6 adj
0x61CB796C 4197632 64 IP Flow cache
0x619623B0 3248128 23072 EIGRP: mgd_timer
0x61B3E994 3231588 100 CEF: fib
....
The Head column - refers to the address (in hexadecimal) of the memory allocation chain.
The Total column - the total of used bytes and free bytes, which are individually shown in their own columns.
The Lowest column - shows the lowest amount of free memory (in bytes) that has been available since the router last booted.
The Largest column - indicates the largest block of available memory.
7609# show memory ?
allocating-process Show allocating process name
console Console memory
dead Memory owned by dead processes
debug Memory debugging commands
failures Memory failures
fast Fast memory stats
fragment Summary of memory fragment information
free Free memory stats
io IO memory stats
lite-chunks Malloc lite info
multibus Multibus memory stats
overflow memory overflow corrections
pci PCI memory stats
processor Processor memory stats
statistics Mempool Statistics
summary Summary of memory usage per alloc PC
transient Transient memory stats
| Output modifiers
<cr>
7609#
Summary of memory usage per alloc PC:
7609#show memory summary
Head Total(b) Used(b) Free(b) Lowest(b) Largest(b)
Processor 4711F620 887982560 336225864 551756696 81854040 532980404
I/O 8000000 67108864 13782220 53326644 53082432 53019324
Processor memory
Alloc PC Size Blocks Bytes What
0x4010D854 0000001024 0000000001 0000001024 AAA flow handle IDs
0x4010F0B4 0000000152 0000000001 0000000152 AAA Acct Req chunk
0x4010F0E0 0000065536 0000000001 0000065536 AAA Acct Req ch
0x40112C18 0000000116 0000000001 0000000116 AAA chunk
0x40113AF4 0000016588 0000000001 0000016588 AAA chunk
0x40118A7C 0000000240 0000000001 0000000240 (coalesced) (Free Blocks)
0x40118AA0 0000000240 0000000471 0000113040 (coalesced) (Free Blocks)
2) Memory allocation failure
- A memory allocation failure (which produces a MALLOCFAIL error message) occurs when a process attempts to allocate a block of memory and fails to do so.
- One common cause for a MALLOCFAIL error is a security issue.
- For example, a virus or a worm that has infested the network can result in a MALLOCFAIL error.
- Alternatively, a MALLOCFAIL error might be the result of a bug in the router’s version of Cisco IOS.
- You can use the Cisco Bug Toolkit (available from http://www.cisco.com/cgi-bin/Support/Bugtool/launch_bugtool.pl) to research any such known issues with the version of Cisco IOS running on a router.
3) Buffer leak
- Similar to a memory leak, in which a process does not return all of its allocated memory to the router upon terminating, a buffer leak occurs when a process does not return a buffer to the router when the process has finished using the buffer.
- Like a memory leak, a buffer leak might require updating the Cisco IOS image of a router.
R4#show interfacesThese values indicate that an input queue of the interface has a capacity of 75 packets, and that queue currently has 76 packets.
...OUTPUT OMITTED...
Input queue: 76/75/780/0 (size/max/drops/flushes); Total output drops: 0
This is an oversubscription of the queue space. An interface in this condition is called a wedged interface.
In such a condition, the router does not forward traffic coming into the wedged interface.
R1#show buffersExcessive BGP Memory Use
Buffer elements:
943 in free list (500 max allowed)
4263548792 hits, 0 misses, 617 created
Public buffer pools:
Small buffers, 104 bytes (total 104, permanent 50, peak 208 @ 7w0d):
98 in free list (20 min, 150 max allowed)
2119618475 hits, 55049 misses, 60759 trims, 60813 created
.....
Interface buffer pools:
Syslog ED Pool buffers, 600 bytes (total 283, permanent 282, peak 283 @ 7w0d):
251 in free list (282 min, 282 max allowed)
773595 hits, 0 misses
....
Header pools:
Header buffers, 0 bytes (total 512, permanent 256, peak 512 @ 7w0d):
256 in free list (256 min, 1024 max allowed)
....
Public particle pools:
F/S buffers, 128 bytes (total 512, permanent 512):
0 in free list (0 min, 512 max allowed)
512 hits, 0 misses, 0 trims, 0 created
....
Private particle pools:
HQF buffers, 0 bytes (total 2000, permanent 2000):
2000 in free list (500 min, 2000 max allowed)
0 hits, 0 misses, 0 trims, 0 created
0 failures (0 no memory)
GigabitEthernet0/1 buffers, 512 bytes (total 1000, permanent 1000):
0 in free list (0 min, 1000 max allowed)
1000 hits, 0 fallbacks
...
- If a router is running BGP, be aware that BGP runs multiple processes and can consume significant amounts of router memory.
- If BGP is consuming a large percentage of your router memory, you might consider filtering out unneeded BGP routes, upgrading the memory on that router, or running BGP on a different platform that has more memory.
R1#show processes memory | include PID|Free|BGP- Depending on the router platform, your router might have multiple line cards with different amounts of memory available on each line card.
Processor Pool Total: 368411916 Used: 107929020 Free: 260482896
I/O Pool Total: 33554432 Used: 7149504 Free: 26404928
Transient Pool Total: 16777216 Used: 383708 Free: 16393508
PID TTY Allocated Freed Holding Getbufs Retbufs Process
92 0 0 0 10124 0 0 BGP Scheduler
183 0 496107632 0 141332 4219752 4219752 BGP I/O
197 0 0 2873892 10096 0 0 BGP Scanner
228 0 0 0 7096 0 0 BGP Event
309 0 229584 0 236816 0 0 BGP Task
323 0 24671184 499481756 19466776 124 124 BGP Router
R1#
- show diag - can help you isolate a specific line card that is running low on memory, perhaps because that line card is running BGP.
CORE DUMPS
https://www.cisco.com/en/US/docs/internetworking/troubleshooting/guide/tr19aa.html
https://www.cisco.com/c/en/us/support/docs/ios-nx-os-software/ios-software-releases-122-mainline/12687-appA.html
When a router crashes, it is sometimes useful to obtain a full copy of the memory image (called a core dump) to identify the cause of the crash. Core dumps are generally very useful to your technical support representative. Not all crash types will produce a core dump.
Caution: Core dumps are not necessary to solve most crash cases. Creation of a core dump while the router is functioning in a network can disrupt network operation. Use the commands in this document only under the direction of a technical support representative.
There are four basic ways to set up the router to generate a core dump, through:
1) FTP (File Transfer Protocol)
ip ftp usename username
ip ftp password password
exception protocol ftp
exception dump a.b.c.d
2) RCP (Remote Copy Protocol)
exception protocol rcp
exception dump a.b.c.d
3) Flash Disk
exception flash <procmem|iomem|all> <device_name[:partition_number]> <erase | no_erase>
exception dump a.b.c.d